Data availability
The sequencing data reported in this paper have been deposited in NCBI’s Gene Expression Omnibus under accession GSE277746 (ref. 40). Structural data have been deposited in PDB codes (9H6Y, 9H74). Source data are provided with this paper.
Code availability
Custom Python scripts used to analyze the sequencing data are available on GitHub (https://github.com/usa0ri/Jia2025/tree/master)41. They are also deposited on Zenodo (https://doi.org/10.5281/zenodo.17254007).
References
-
Shirokikh, N. E. & Preiss, T. Translation initiation by cap-dependent ribosome recruitment: recent insights and open questions. Wiley Interdiscip. Rev. RNA 9, e1473 (2018).
-
Brito Querido, J., Diaz-Lopez, I. & Ramakrishnan, V. The molecular basis of translation initiation and its regulation in eukaryotes. Nat. Rev. Mol. Cell Biol. 25, 168–186 (2023).
-
Sonenberg, N. & Dever, T. E. Eukaryotic translation initiation factors and regulators. Curr. Opin. Struct. Biol. 13, 56–63 (2003).
-
Brito Querido, J. et al. Structure of a human 48S translational initiation complex. Science 369, 1220–1227 (2020).
-
Pelletier, J. & Sonenberg, N. The organizing principles of eukaryotic ribosome recruitment. Annu. Rev. Biochem. 88, 307–335 (2019).
-
Hinnebusch, A. G. The scanning mechanism of eukaryotic translation initiation. Annu. Rev. Biochem. 83, 779–812 (2014).
-
Ingolia, N. T., Lareau, L. F. & Weissman, J. S. Ribosome profiling of mouse embryonic stem cells reveals the complexity and dynamics of mammalian proteomes. Cell 147, 789–802 (2011).
-
Lee, S., Liu, B., Huang, S. X., Shen, B. & Qian, S. B. Global mapping of translation initiation sites in mammalian cells at single-nucleotide resolution. Proc. Natl Acad. Sci. USA 109, E2424–E2432 (2012).
-
Orr, M. W., Mao, Y., Storz, G. & Qian, S. B. Alternative ORFs and small ORFs: shedding light on the dark proteome. Nucleic Acids Res. 48, 1029–1042 (2020).
-
Hinnebusch, A. G., Ivanov, I. P. & Sonenberg, N. Translational control by 5’-untranslated regions of eukaryotic mRNAs. Science 352, 1413–1416 (2016).
-
Chen, J. et al. Pervasive functional translation of noncanonical human open reading frames. Science 367, 1140–1146 (2020).
-
Otoupal, P. B., Cress, B. F., Doudna, J. A. & Schoeniger, J. S. CRISPR-RNAa: targeted activation of translation using dCas13 fusions to translation initiation factors. Nucleic Acids Res. 50, 8986–8998 (2022).
-
Cao, Y. et al. RNA-based translation activators for targeted gene upregulation. Nat. Commun. 14, 6827 (2023).
-
Crooke, S. T., Baker, B. F., Crooke, R. M. & Liang, X. H. Antisense technology: an overview and prospectus. Nat. Rev. Drug Discov. 20, 427–453 (2021).
-
Chen, H. et al. Chemical and topological design of multicapped mRNA and capped circular RNA to augment translation. Nat. Biotechnol. 43, 1128–1143 (2024).
-
Dersh, D., Yewdell, J. W. & Wei, J. A SIINFEKL-based system to measure MHC class I antigen presentation efficiency and kinetics. Methods Mol. Biol. 1988, 109–122 (2019).
-
Gu, Y., Mao, Y., Jia, L., Dong, L. & Qian, S. B. Bi-directional ribosome scanning controls the stringency of start codon selection. Nat. Commun. 12, 6604 (2021).
-
Lee, A. S., Kranzusch, P. J., Doudna, J. A. & Cate, J. H. eIF3d is an mRNA cap-binding protein that is required for specialized translation initiation. Nature 536, 96–99 (2016).
-
Simonetti, A., Guca, E., Bochler, A., Kuhn, L. & Hashem, Y. Structural insights into the mammalian late-stage initiation complexes. Cell Rep. 31, 107497 (2020).
-
Chen, R. et al. Engineering circular RNA for enhanced protein production. Nat. Biotechnol. 41, 262–272 (2023).
-
Calvo, S. E., Pagliarini, D. J. & Mootha, V. K. Upstream open reading frames cause widespread reduction of protein expression and are polymorphic among humans. Proc. Natl Acad. Sci. USA 106, 7507–7512 (2009).
-
Vattem, K. M. & Wek, R. C. Reinitiation involving upstream ORFs regulates ATF4 mRNA translation in mammalian cells. Proc. Natl Acad. Sci. USA 101, 11269–11274 (2004).
-
Ameri, K. & Harris, A. L. Activating transcription factor 4. Int. J. Biochem. Cell Biol. 40, 14–21 (2008).
-
Calkhoven, C. F., Muller, C. & Leutz, A. Translational control of C/EBPα and C/EBPβ isoform expression. Genes Dev. 14, 1920–1932 (2000).
-
Descombes, P. & Schibler, U. A liver-enriched transcriptional activator protein, LAP, and a transcriptional inhibitory protein, LIP, are translated from the same mRNA. Cell 67, 569–579 (1991).
-
Muller, C. et al. Reduced expression of C/EBPβ-LIP extends health and lifespan in mice. eLife 7, e34985 (2018).
-
Faghihi, M. A. & Wahlestedt, C. Regulatory roles of natural antisense transcripts. Nat. Rev. Mol. Cell Biol. 10, 637–643 (2009).
-
Pelechano, V. & Steinmetz, L. M. Gene regulation by antisense transcription. Nat. Rev. Genet. 14, 880–893 (2013).
-
Coban, I. et al. dsRNA formation leads to preferential nuclear export and gene expression. Nature 631, 432–438 (2024).
-
Reis, R. S. & Poirier, Y. Making sense of the natural antisense transcript puzzle. Trends Plant Sci. 26, 1104–1115 (2021).
-
Gu, W. et al. CapSeq and CIP-TAP identify Pol II start sites and reveal capped small RNAs as C. elegans piRNA precursors. Cell 151, 1488–1500 (2012).
-
Young, S. K., Baird, T. D. & Wek, R. C. Translation regulation of the glutamyl-prolyl-tRNA synthetase gene EPRS through bypass of upstream open reading frames with noncanonical initiation codons. J. Biol. Chem. 291, 10824–10835 (2016).
-
Wan, J. & Qian, S. B. TISdb: a database for alternative translation initiation in mammalian cells. Nucleic Acids Res. 42, D845–D850 (2014).
-
Werner, A., Kanhere, A., Wahlestedt, C. & Mattick, J. S. Natural antisense transcripts as versatile regulators of gene expression. Nat. Rev. Genet. 25, 730–744 (2024).
-
Wilson, R. C. & Doudna, J. A. Molecular mechanisms of RNA interference. Annu. Rev. Biophys. 42, 217–239 (2013).
-
Carrieri, C. et al. Long non-coding antisense RNA controls Uchl1 translation through an embedded SINEB2 repeat. Nature 491, 454–457 (2012).
-
Yang, Y. & Wang, Z. IRES-mediated cap-independent translation, a path leading to hidden proteome. J. Mol. Cell. Biol. 11, 911–919 (2019).
-
Bogaert, A., Fernandez, E. & Gevaert, K. N-terminal proteoforms in human disease. Trends Biochem. Sci. 45, 308–320 (2020).
-
Mao, Y., Jia, L., Dong, L., Shu, X. E. & Qian, S. B. Start codon-associated ribosomal frameshifting mediates nutrient stress adaptation. Nat. Struct. Mol. Biol. 30, 1816–1825 (2023).
-
Gene Expression Omnibus. Programmable initiation of mRNA translation by trans-RNA. www.ncbi.nlm.nih.gov/geo/query/acc.cgi?acc=GSE277746 (2025).
-
Jia, L. et al. usa0ri/Jia2025. GitHub github.com/usa0ri/Jia2025/tree/master (2025).
Acknowledgements
We thank Cornell University Life Sciences Core Laboratory Center for sequencing and fluorescence-activated cell sorting. S.U. was supported by Takeda Science Foundation. This work was supported by European Research Council Consolidator Grant SPICTRANS (101088541 to Y.H.), US National Institutes of Health (DP1GM142101 to S.-B.Q.) and HHMI Faculty Scholar (55108556 to S.-B.Q.).
Ethics declarations
Competing interests
S.-B.Q. is the cofounder of EzraBio. S.-B.Q. and L.J. are inventors of trans-RNA technology with patent (PCT/US2024/17174) filed by Cornell University. The other authors declare no competing interests.
Peer review
Peer review information
Nature Biotechnology thanks Howard Chang and the other, anonymous, reviewer(s) for their contribution to the peer review of this work.
Additional information
Publisher’s note Springer Nature remains neutral with regard to jurisdictional claims in published maps and institutional affiliations.
Extended data
Extended Data Fig. 1 Assessing the effect of 5’UTR structures on mRNA translation.
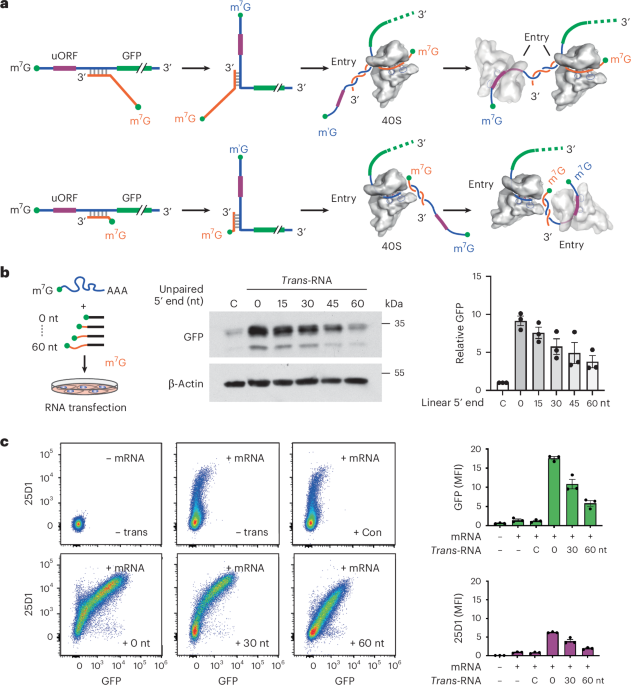
a, Schematic of the uORF-GFP reporter, which contains a uORF encoding SIINFEKL (purple) followed by GFP (green). After transfection into HEK293-Kb cells, both SIINFEKL and GFP levels can be measured by flow cytometry using a monoclonal antibody 25D1. b, A representative flow cytometry scatterplot of HEK293-Kb cells transfected with the uORF-GFP reporter. Mean fluorescence intensity (MFI) of GFP and 25D1 signals is shown. c, Representative flow cytometry scatter plots of HEK293-Kb cells transfected with uORF-GFP reporters bearing a stem structure within the uORF (left panel) or before the uORF (right panel). Mean fluorescence intensity (MFI) of GFP and 25D1 signals is shown. d, The left panel shows the stem sequence and the predicted free energy. The middle panel shows the translation efficiency of Fluc mRNA reporters harboring a stem loop near the 5′ cap followed by the Fluc start codon at varied distances (orange). Relative mRNA levels were shown in the right panel. Error bars, mean ± s.e.m. n = 3 biological replicates. e, HEK293-Kb cells were transfected with a mixture of target mRNA and trans-RNA with varied 5’ unpaired extensions. The bar graph shows the steady-state mRNA levels of the mRNA reporters determined by RT-qPCR. Error bars, mean ± s.e.m. n = 4 biological replicates. P values were calculated by one-way ANOVA with Dunnett’s multiple comparisons (for multiple groups).
Extended Data Fig. 2 Trans-RNA promotes ribosome scanning on the target mRNA.
a, A representative plot shows the Cy5 beacon signals in the presence or absence of the quencher IBRQ. b, A representative plot shows the release of the Cy5 beacon in the presence of active or inactive RRL. c, A representative plot shows the release of the Cy5 beacon in the presence or absence of the quencher antisense (AS). d, A bar graph shows GFP levels in HEK293-Kb cells transfected with a mixture of target mRNA and trans-RNA with varied length of paired regions. Error bars, mean ± s.e.m. n = 3 biological replicates. P values were calculated by unpaired two-tailed Student’s t-test. e, A bar graph shows GFP levels in HEK293-Kb cells transfected with a mixture of target mRNA and trans-RNA (44 nt) with or without poly(A) tails. Error bars, mean ± s.e.m. n = 3 biological replicates. P values were calculated by unpaired two-tailed Student’s t-test. f, Top panel shows the schematic of trans-RNAs harboring varied mismatches. The bottom panel shows GFP levels in transfected cells in the presence of trans-RNAs with different mismatches. Error bars, mean ± s.e.m. n = 3 biological replicates.
Extended Data Fig. 3 Cryo-EM image processing workflow and average resolutions of the final structures.
a, Summary of the image processing workflow in CRYOSPARC. b, Representative images of samples showing monodispersion and the concentration of the particles. c, Top 2D classes after particles picking. d, 2D classes showing 40S-like particles were further classified. e, 2D classes showing 80S-like particles were further classified separately. f, 40S-like particles of the best 2D classes were pooled together, followed by ab initio reconstruction and subsequent 3D sorting through focused 3D classification in a density mask (upper panel). Only 3 classes showing sturdy and homogeneous reconstructions displaying hints of initiation factors were retrieved (lower panel). g, One of the three classes shows the presence of eIF3 and was used for the non-uniform refinement, yielding reconstruction of the 48S late-stage initiation complex with eIF3, at an average resolution of ~3 Å (right panel). h, The remaining two 3D classes were pooled together and used for the non-uniform refinement, yielding reconstruction of the 48S late-stage initiation complex without eIF3, at an average resolution of ~2.9 Å (right panel). i,j, Both final reconstructions of the 48S late-stage initiation complex with (j) and without (i) eIF3 were subsequently enhanced using DeePEMhancer wrapped in CRYOSPARC. k, The density mask that was used for the focused 3D classification.
Extended Data Fig. 4 Structural characterization of mammalian late-stage 48S initiation complexes (LS48S IC).
a, Segmented cryo-EM reconstructions of the LS48S IC from solvent (left), intersubunit (middle) and platform sides (right). The reconstruction shows 18S rRNA (yellow), eIF2γ (orange), eIF2α (purple), ({{rm{tRNA}}}_{{rm{i}}}^{{rm{Met}}}) (magenta), mRNA (red), eIF1A (dark blue), eIF5 N-terminal domain (sky blue) and ABCE1 (green). b, Segmented map showing electron density of the eIF3 core (red) attached to the 48S viewed from the platform side. The square highlights the codon–anticodon base-pairing view in LS48S-eIF3 ICs. c, Ribbon representation of the atomic model of LS48S-eIF3 IC seen from the platform side. The square highlights close-up of eIF3a interactions with ribosomal proteins shown in mixed ribbon-and-stick representation. Specifically, eIF3a residues Asn10, Arg14, Glu17 interacting with eS1 residues Glu78, Asp77, Gln75, respectively, and eIF3a residues Arg7 with eS26 residue Asn77. d, Close-up of the eIF3c (navy blue) interaction with 40S: h26 (ES7) of 18S rRNA and eS27. Specifically, eIF3c residues Lys342, Lys343, Asn388 interact with nucleotides G925, C1112 and U1116, respectively, and the latter two being a part of the apical loop of expansion segment 7 (ES7) of 18S rRNA.
Extended Data Fig. 5 Front- and back-loading pathways guided by trans-RNAs.
a, Characterizing linear and circular nLuc RNAs produced using enzymatic ligation. Circular RNA was purified and confirmed by RNase R digestion followed by agarose gel separation. At least three biological replicates were conducted. b, Possible mechanisms of ‘blind spot’ formation when the trans-cap (green) is positioned at the −6 nt of the nLuc start codon. Upon ribosome back-loading, the trans-RNA (orange) undergoes dissociation by the scanning ribosome. Before the ribosome reaches the nLuc start codon, re-association of trans-RNA in the mRNA channel impedes the recognition of the nFluc start codon. c, The left panel shows the schematic of ribosome loading pathways on a linear target mRNA guided by trans-RNA. The middle panel shows the relative positions of trans-RNA on the linear target mRNA. The HiBiT signals in transfected cells were presented as a bar graph (right panel). Error bars, mean ± s.e.m. n = 3 biological replicates. d, The left panel shows schematics of circ-GFP with or without CVB3-IRES in the absence or presence of trans-RNA. The right panel shows relative GFP levels in transfected cells. Error bars, mean ± s.e.m. n = 3 biological replicates.
Extended Data Fig. 6 Circular RNA translation guided by trans-RNAs.
a, Bar graphs show linear and circular nLuc levels in HEK293-Kb cells co-transfected with trans-RNAs of 15 nt or 44 nt. The ratio of trans-RNA to the target mRNA is 59:1 and 21:1, respectively. Both the target mRNA and trans-RNA were incorporated with the clean cap and 1-methyl pseudouridine (m1ψ). The steady-state nLuc mRNA levels were quantified by RT-qPCR (blue bar graphs). Error bars, mean ± s.e.m. n = 3 biological replicates. b, Schematic of lipid nanoparticles (LNP) formulation using an ethanolic lipid mixture composed of ionizable amino lipid SM-102, 1,2-DSPC, cholesterol, and DMG-PEG at desired lipid molar ratios (see details in Methods).
Extended Data Fig. 7 Trans-RNA controls alternative translation of ATF4.
a, Schematic of translational regulation of ATF4. The uORF2 of ATF4 is translated via leaky scanning (left panel) or reinitiation (right panel). Under normal growth conditions, the active uORF2 translation represses translation of the ATF4 coding region. In response to amino acid starvation, a delayed reinitiation skips the uORF2 translation, which enables translation of the ATF4 coding region. b, A bar graph shows relative endogenous Atf4 mRNA levels in HEK293-Kb cells transfected with indicated trans-RNAs targeting the main start codon of ATF4. Error bars, mean ± s.e.m. n = 4 biological replicates. P values were calculated one-way ANOVA with Dunnett’s multiple comparisons. c, The left panel shows representative western blots of ATF4 in HEK293-Kb cells transfected with increasing doses of trans-RNAs targeting the main start codon of ATF4. The right panel shows quantification of ATF4 protein levels. Error bars, mean ± s.e.m. n = 4 biological replicates. d, A bar graph shows relative endogenous ATF4 mRNA levels in HEK293-Kb cells transfected with indicated trans-RNAs targeting the start codon of uORF2. Error bars, mean ± s.e.m. n = 4 biological replicates. P values were calculated by one-way ANOVA with Dunnett’s multiple comparisons.
Extended Data Fig. 8 Evaluating ‘off-targets’ of trans-RNA.
a, Representative polysome profiles of amino acid-starved HEK293-Kb cells transfected with trans-RNAs targeting the uORF2 of ATF4. b, Metagene analysis of CDS ribosome occupancy in amino acid-starved HEK293-Kb cells transfected with trans-RNAs targeting the uORF2 of ATF4. c, Scatter plots show the correlation of read ratio (5’UTR/CDS) between amino acid-starved HEK293-Kb cells with or without trans-RNAs targeting the uORF2 of ATF4. The right panel shows the same correlation between two biological replicates. d, ORFs were first identifed from Ribo-seq data sets obtained from HEK293 cells using PRICE. Changes of ORF read density in response to starvation with or without trans-RNA were shown in two biological replicates. e, A volcano plot shows differential translation of the identified ORFs in response to starvation with or without trans-RNA. f, Representative polysome profiles of fasted mouse liver with or without administration of trans-RNAs targeting the uORF2 of ATF4. g, Metagene analysis of CDS ribosome occupancy in fasted mouse liver with or without administration of trans-RNAs targeting the uORF2 of ATF4. h, Scatter plots show the correlation of read ratio (5’UTR/CDS) between fasted mouse liver with or without administration of trans-RNAs targeting the uORF2 of ATF4. The right panel shows the same correlation between two biological replicates.
Extended Data Fig. 9 Trans-RNA controls alternative translation of C/EBPβ.
a, Schematic of alternative translation of C/EBPβ. Start codons for LAP1, LAP2, and LIP are marked by arrowheads with the embedded uORF colored in purple. C/EBPβ isoforms are shown below. b, Relative mRNA levels of Cebpb in 3T3-L1 cells transfected with trans-RNAs targeting the uORF or LIP of C/EBPβ. Error bars, mean ± s.e.m. n = 3 biological replicates. c, Microscope images of differentiated 3T3-L1 cells transfected with trans-RNAs targeting the uORF or LIP of C/EBPβ. d, Oil Red O staining of differentiated 3T3-L1 cells transfected with trans-RNAs targeting the uORF or LIP of C/EBPβ. e, Immunoblotting of adipogenesis biomarkers FAS and SREBP1 in differentiated 3T3-L1 cells transfected with trans-RNAs targeting the uORF or LIP of C/EBPβ. f, FVB mice were administered via retro-orbital injection with trans-RNAs targeting the uORF or LIP of C/EBPβ every other day. The liver tissues were collected at day 10 for immunoblotting. g, Relative mRNA levels of Cebpb in mouse livers administered with trans-RNAs targeting the uORF or LIP of C/EBPβ. Error bars, mean ± s.e.m. n = 3 biological replicates. Statistical significance was calculated by unpaired two-tailed Student’s t test. n.s., no significance.
Extended Data Fig. 10 Characterizing natural trans-RNAs in mammalian cells.
a, Schematic of modified CapSeq methodology for detection of natural trans-RNAs in HEK293 cells (see details in Methods). b, Read plots of CapSeq for the gene STARD7 show both sense (deep violet) and antisense (dark blue) strands. c, Gene ontology analysis of genes with natural trans-RNAs in HEK293 cells. d, Relative mRNA levels of EPRS1 in HEK293 cells transfected with the capped EPRS1 antisense (trans-EPRS1). Error bars, mean ± s.e.m. n = 3 biological replicates. P values were calculated by unpaired two-tailed Student’s t-test. e, Western blotting of HEK293 cells transfected with the trans-EPRS1 with or without neutralizing antisense (AS) oligos. f, A Venn diagram shows genes with overlapping trans-RNA peaks from CapSeq and initiation peaks from GTI-seq within a window of ±180 nt. g, Relative mRNA levels of ARF1 in HEK293 cells transfected with the capped EPRS1 antisense (AS). Error bars, mean ± s.e.m. n = 3 biological replicates. P values were calculated by unpaired two-tailed Student’s t-test. h, Western blotting of HEK293 cells transfected with the trans-ARF1 with or without neutralizing antisense (AS) oligos.
Supplementary information
Source data
Source Data Figs. 1, 2, 4, 5 and 6 and Extended Data Figs. 1, 2, 5, 6, 7, 9 and 10
Statistical source data for Figs. 1b,c, 2c, 4b–d, 5d and 6a–d and Extended Data Figs. 1d,e, 2d–f, 5c,d, 6a, 7b–d, 9b,g and 10d,g.
Source Data Fig. 1
Unprocessed and uncropped scans.
Source Data Fig. 4
Unprocessed and uncropped scans.
Source Data Fig. 5
Unprocessed and uncropped scans.
Source Data Fig. 6
Unprocessed and uncropped scans.
Source Data Extended Data Fig. 5
Unprocessed and uncropped scans.
Source Data Extended Data Fig. 7
Unprocessed and uncropped scans.
Source Data Extended Data Fig. 9
Unprocessed and uncropped scans.
Rights and permissions
Springer Nature or its licensor (e.g. a society or other partner) holds exclusive rights to this article under a publishing agreement with the author(s) or other rightsholder(s); author self-archiving of the accepted manuscript version of this article is solely governed by the terms of such publishing agreement and applicable law.
About this article

Cite this article
Jia, L., Nguyen, TT., Uematsu, S. et al. Programmable initiation of mRNA translation by trans-RNA. Nat Biotechnol (2025). https://doi.org/10.1038/s41587-025-02897-1
-
Received:
-
Accepted:
-
Published:
-
Version of record:
-
DOI: https://doi.org/10.1038/s41587-025-02897-1